Introduction
The Regulated Ecosystem Model, version 2, (REcoM-2) describes the biogeochemistry in the ocean with a relatively simple ecological model including two phytoplankton functional types (diatoms and non-diatoms), one zooplankton and one detritus compartment, and inorganic and organic forms of the main nutrients (Figure Fig. 1). Some emphasis is put on phytoplankton physiology, which is described in a way that allows for changes in cellular stoichiometry (N:C:Chl:Si for diatoms and N:C:Chl for non-diatoms, respectively). All in all, the model solves mass balance equations for 21 tracers, which are described by equations of the type
where \(\mathbf{A}\) is the volumetric concentration of a tracer, \(\mathbf{U}\) is the three-dimensional advection velocity and \(\kappa\) is the diffusivity, both supplied by the physical circulation model. The sinking velocity of particles \(\mathbf{w} = (0,0,w)\) increases linearly with depth for detritus and has a constant value for phytoplankton and diatoms.
\(\mathbf{S(A)}\) are the biogeochemical sources or sinks of the tracer \(\mathbf{A}\) and are described in detail, for any of the tracers, in the following (see table Table 2 in the appendix section Appendix to identify the tracers in the code).
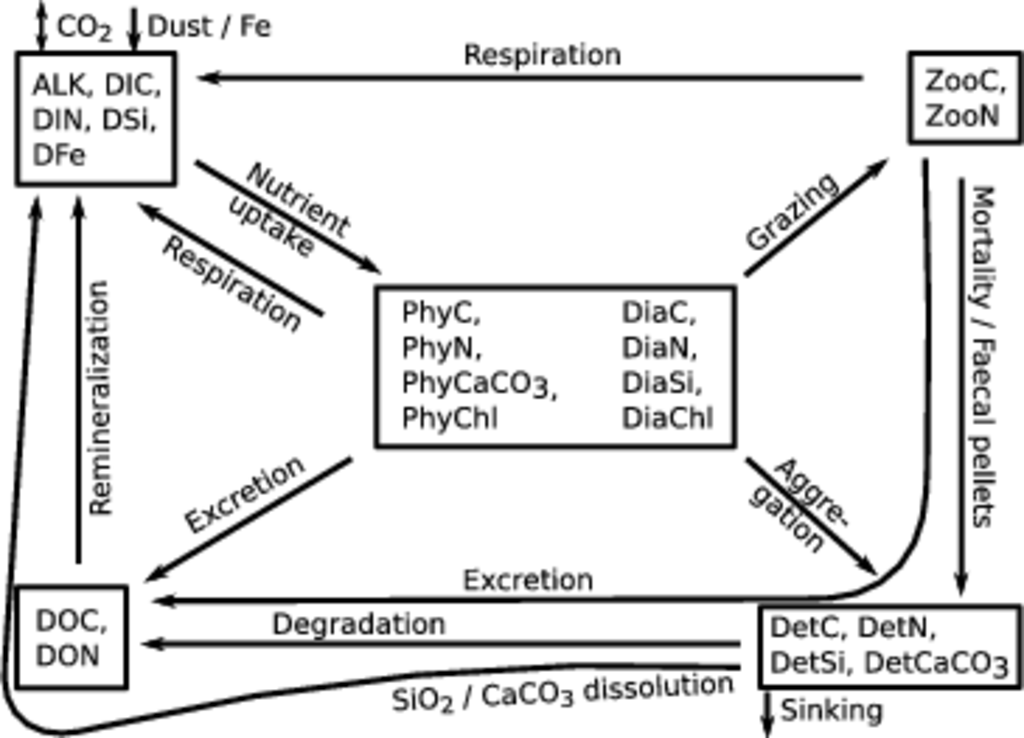
Fig. 1 Schematic sketch of the ecosystem model REcoM-2. The 21 tracers can be grouped (indicated by boxes) into dissolved nutrients and carbonate system parameters (upper left), phytoplankton (center), zooplankton (upper right), detritus (lower right), and dissolved organic material (lower left). Source and sink terms are depicted by arrows, short arrows denote exchange with atmosphere and sediments. Not shown: sediments also release alkalinity, inorganic nutrients and dissolved organic matter.
Carbonate chemistry
Dissolved inorganic carbon (\(\mathrm{DIC}\))
The balance of \(\mathrm{DIC}\) is affected by a number of processes; sources for DIC are respiration by nanophytoplankton (\(phy\)), diatoms (\(dia\)) and heterotrophs (\(het\)), remineralization of dissolved organic carbon (\(\mathrm{DOC}\)) and dissolution of calcitic detritus (\(det\)). Sinks are carbon fixation by primary producers and the formation of calcium carbonate (\(Z\)). In addition, sea-air flux of \(CO_2\) (\(F_{\mathrm{C}}\)) leads to an exchange of carbon with the atmosphere, depending on the partial pressure difference of \(CO_2\) between ocean and atmosphere. This exchange is treated separately as boundary condition in section
See section Phytoplankton for details on photosynthesis (\(p\)) and phytoplankton respiration (\(r\)) rates. \(\mathrm{C}_{phy}\), \(\mathrm{C}_{dia}\) and \(\mathrm{C}_{het}\) refer to carbon biomass of nanophytoplankton, diatoms and heterotrophs, respectively. See section Heterotrophs for the formulation of the heterotrophic respiration rate (\(r_{het}\)) and section Dissolved Organic Matter (DOM)} for the DOC remineralization term (\(\rho_{\mathrm{DOC}} \cdot f_T \cdot \mathrm{DOC}\)). The calcite dissolution rate (\(\lambda\)) is defined in Eq. (48) and the calcification flux (\(Z\)) in Eq. (36).
Total Alkalinity (\(\mathrm{TA}\))
The alkalinity balance is determined by processes co-occurring with primary production and remineralization of dissolved organic matter. Alkalinity is increased by nitrogen assimilation and reduced by remineralization of dissolved organic nitrogen (DON). The contribution of phosphate assimilation and remineralization to alkalinity is taken into account by assuming a constant Redfield ratio (16:1) relating \(\mathrm{DON}\) to dissolved organic phosphorous (\(\mathrm{DOP}\)). Further, alkalinity is reduced during calcification and increased during dissolution of \(CaCO_3\).
See section Phytoplankton for details on the nitrogen assimilation rates (\(a^N_{phy}\) and \(a^N_{dia}\)), and section Dissolved Organic Matter (DOM) for the \(\mathrm{DON}\) remineralization term (\(\rho_{\mathrm{DON}} \cdot f_T \cdot \mathrm{DON}\)). The calcification flux (\(Z\)) is defined in Eq. (36) and the dissolution rate of \(CaCO_3\) (\(\lambda\)) in Eq. (48).
Nutrients
Dissolved Inorganic Nitrogen (\(\mathrm{DIN}\))
\(\mathrm{DIN}\) in the model is the sum of the concentrations of nitrate, nitrite and ammonia. The \(\mathrm{DIN}\) pool in the water column is reduced when nanophytoplankton and diatoms take up \(\mathrm{DIN}\) and build it into their cells. Remineralization of \(\mathrm{DON}\) is a source for \(\mathrm{DIN}\).
See section Phytoplankton for details on the nitrogen assimilation rates (\(a^N_{phy}\) and \(a^N_{dia}\)) and section Dissolved Organic Matter (DOM) for an explanation of the temperature dependent \(\mathrm{DON}\) remineralization.
Dissolved Silicate (\(\mathrm{DSi}\))
Silicon cycles between dissolved silicic acid, or silicate \(\mathrm{DSi}\), and the biogenic silica in diatoms \(\mathrm{Si}_{dia}\) and detritus (\(\mathrm{Si}_{det}\)). Silicate in the water column is drawn down by silicate assimilation and returned via degradation of detritus silica.
See section Phytoplankton for the definition of the silicate assimilation rate (\(a^{Si}_{dia}\)). The temperature-dependent dissolution rate of silica \(\rho^T_{Si}\) is defined in Eq. (46).
Dissolved Iron (\(\mathrm{DFe}\))
Dissolved iron is treated in the model like in citet{Parekh2004}, i.e. it is considered the sum of the concentrations of “free” (i.e.inorganically bound) iron \(\mathrm{Fe}'\) and organically complexed iron \(\mathrm{FeL}\). The partitioning into these two types is assumed to be in chemical equilibrium always, and is calculated at each timestep by solving the law of mass action for a reaction \(\mathrm{Fe}' + \mathrm{L} \leftrightarrows \mathrm{FeL}\) with \(\mathrm{L}\) being the free ligand concentration, assuming both a constant conditional stability constant \(K_{FeL} = \mathrm{Fe}' \cdot L / FeL\) and total ligand concentration \(\mathrm{L}_T = \mathrm{L} + \mathrm{FeL}\).
Dissolved iron is drawn down in concert with photosynthesis by nanophytoplankton and diatoms and by scavenging of free Fe. For the scavenging we assume that it is proportional to detritus carbon, which we take as a proxy for the mass of sinking particles. Iron is released during respiration of phytoplankton and heterotrophs, remineralization of \(\mathrm{DOC}\), and excretion of heterotrophs. Degraded iron is directly remineralized to dissolved iron. For all these processes, we assume a constant iron:carbon ratio (\(q^{Fe}\)).
See section Phytoplankton for an explanation of phytoplankton photosynthesis (\(p\)) and respiration (\(r\)) rates and section Heterotrophs for the heterotrophic respiration (\(r_{het}\)) and carbon excretion rate (\(\epsilon^C_{het}\)). The DOC remineralization term is described in section Dissolved Organic Matter (DOM).
Phytoplankton
The equations for the two classes of phytoplankton are based on a slightly modified version of the physiological model by citet{Geider1998} that has been amended by non-physiological mortality terms, namely grazing and aggregation loss to sinking detritus citep{Schartau2007}. For diatoms an additional equation describing the formation and loss of biogenic silica in the diatom frustule has been added by citet{Hohn2009}.
All physiological rates, such as the photosynthesis and assimilation rates depend on cell quota in the formulation of citet{Geider1998}. These are defined as the intracellular ratios of N:C, Chl:C and Si:C:
In addition quota are used to convert biomass in terms of carbon or nitrogen to Fe, Si, Chl or \(CaCO_3\):
Nitrogen pool (\(\mathrm{N}_{phy}\) and \(\mathrm{N}_{dia}\))
The nitrogen pool in nanophytoplankton and diatoms is built up by the assimilation of nitrogen, which is assumed proportional to carbon biomass. Metabolic processes lead to excretion of biogenic nitrogen to the \(\mathrm{DON}\) pool. At high intracellular N:C ratios (\(q\)), we assume that this excretion is downregulated. Aggregation and grazing by zooplankton transfer nitrogen to the detritus and zooplankton pools:
See section Heterotrophs for a description of the grazing formulation (\(G_{phy}\) and \(G_{dia}\)). The carbon-specific nitrogen uptake rate depends on the maximum photosynthetic rate (\(p_{phy}^{max}\) and \(p_{dia}^{max}\), eq. (20), eq. (21)), which is converted to nitrogen units by multiplication with an optimal N:C uptake ratio (\(\sigma^N_{phy}\) and \(\sigma^N_{dia}\)). Nitrogen uptake rates are further affected by the intracellular nitrogen status \(q\) through \(f^{lim}_{phy}\) and \(f^{lim}_{dia}\), (see Eq. (13) and Eq. (14)) and by extracellular nitrogen concentrations through an assumed Michaelis-Menten uptake kinetics.
As in the model by citet{Geider1998}, both the limiting functions (\(f^{lim}_{phy}\) and \(f^{lim}_{dia}\)) for nitrogen assimilation and excretion rates \(\epsilon^N_{phy}\) and \(\epsilon^N_{dia}\) are treated as functions of the intracellular nitrogen status (i.e., N:C ratios \(q\)).
The mathematical form of how this regulation is described has no specific basis in physiology. In a slight change against the model by citet{Geider1998} we use a uniform general limitation function for all types of quota regulation, which is given by
This regulation function is close to one for \(q_1 << q_2\), but tends to zero for \(q_1\) to \(q_2\); \(\theta\) is a dimensionless constant that determines how close \(q_1\) and \(q_2\) have to be for a significant decrease of \(f\).
With this function we can now formulate the functions limiting nitrogen assimilation as
and
The aggregation rate (\(g\)) is assumed to be proportional to the abundance of phytoplankton and detritus:
The constants \(\phi_{phy}\) and \(\phi_{det}\) are specific aggregation rates (i.e. per unit biomass per unit time) of phytoplankton and detritus, respectively, which reflect the roles of phytoplankton and detritus in the aggregation processes.
Carbon pool (\(\mathrm{C}_{phy}\) and \(\mathrm{C}_{dia}\))
The carbon biomass of nanophytoplankton and diatoms increases as a result of carbon assimilation during photosynthesis. Loss terms include excretion (\(\epsilon\)) of \(\mathrm{DOC}\), which is limited by the availablity of proteins as in the nitrogen pool, respiration (\(r\)), aggregation (\(g\)), and grazing (\(G\)).
Grazing (\(G\)) is calculated on the basis of nitrogen biomass and converted to carbon using the intracellular N:C ratio (\(q_{phy}\), \(q_{dia}\)). See section Heterotrophs for the grazing formulation, Eq. (15) for the aggregation rate \(g\) and Eq. (13) and Eq. (14) for the limiter functions for the carbon excretion rates \(\epsilon^C_{phy}\) and \(\epsilon^C_{dia}\).
The photosynthetic rate (\(p_{phy}\) and \(p_{dia}\)) is a saturating function of the photosynthetically active radiation (\(PAR\)). The saturating light level is affected by the internal chlorophyll status of the cells. The initial slope of the photosynthesis-irradiance-curve is obtained by multiplication of the light harvesting efficiency per chlorophyll (\(\alpha\)) with the intracellular chlorophyll to carbon ratio (\(q^{Chl}\)).
The apparent maximum photosynthetic rates (\(p^{max}_{phy}\) and \(p^{max}_{dia}\)) are based on the true constant maximum photosynthetic rates \(\mu^{max}_{phy}\) and \(\mu^{max}_{dia}\), but vary with the metabolic state of the cell, external dissolved Fe concentration and temperature:
Growth, as most metabolic processes is faster at higher temperatures. We parameterize this by multiplication of the maximum growth rate with an Arrhenius function \(f_T\) of the local temperature (\(T\) in Kelvin), relative to a reference temperature \(T_{ref}\):
Growth-limitation by iron is represented by a Michaelis-Menten term
while nitrogen limitation of nanophytoplankton and diatoms is modeled as a function of the intracellular nitrogen quota \(q\), with growth ceasing completely at a minimum quota \(q_{min}\)
For diatoms, photosynthesis is also downregulated if the cellular Si:C ratio (\(q^{Si}\)) approaches a minimum ratio \(q^{Si}_{min}\)
\(\theta_{min}\) and \(\theta_{min}^{Si}\) are dimensionless constants which regulate the steepness of the quota-growth relation (see Eq. ref{eq:lim}).
The respiration rates (\(r_{phy}\) and \(r_{dia}\)) represent the sum of maintenance metabolic losses and the costs of biosynthesis, which are proportional to the rates of nutrient assimilation:
See Eq. (13) and Eq. (14) for the limiting functions \(f^{lim}\) of the constant maintenance respiration rates \(\eta_{phy}\) and \(\eta_{dia}\). \(\zeta\) denotes the cost for nutrient uptake and synthesis of cellular machinery in mol carbon per mol of nitrogen and silicon, respectively. See Eq. (11), Eq. (12) and Eq. (33) for details of the nutrient assimilation rates.
Chlorophyll (\(\mathrm{Chl}_{phy}\) and \(\mathrm{Chl}_{dia}\))
Chlorophyll synthesis is modeled as a function of irradiance and of nitrogen assimilation. Chlorophyll is degraded with a fixed rate (\(d^{Chl}\)), and lost via aggregation (\(g\)) and grazing (\(G\)).
See Eq. (15) for the aggregation rate (\(g\)). The grazing flux \(G\) in terms of nitrogen biomass is converted to chlorophyll using the intracellular Chl:N ratio (\(q^{Chl:N}\)).
The chlorophyll synthesis rate \(s\) is assumed to be proportional to the nitrogen assimilation rate, as nitrogen is required for the synthesis of chlorophyll, for light harvesting and in the photosynthetic apparatus:
The carbon-specific nitrogen assimilation rates (\(a_{phy}^{N}\) and \(a_{dia}^{N}\), see Eq. (11) and (12)) are converted to chlorophyll units by multiplication with a constant maximum Chl:N ratio (\(q_{phy\;max}^{Chl:N}\)) and (\(q_{dia\,max}^{Chl:N}\)). The regulation term \(\min(1, p_{phy} / (\alpha_{phy} \cdot q^{Chl}_{phy} \cdot PAR) )\) reflects the ratio of enery assimilated to energy absorbed; it increases under low irradiance and declines as photosynthesis becomes light saturated and/or nutrient limited. See Eq. (18) and Eq. (19) for the descriptions of photosynthesis rate \(p_{phy}\) and \(p_{dia}\).
Diatom silica pool (\(\mathrm{Si}_{dia}\))
The silica frustule of diatoms is built through silicate assimilation. Any term that leads to a decrease in N-biomass through excretion, grazing or aggregation, on the other hand, leads to a corresponding transfer of silica to the detritus silica pool.
The intracellular Si:N ratio \(q^{Si:N}_{dia}\) is used to convert the grazing flux \(G_{dia}\) (Eq. (41)) to the corresponding loss in biogenic silica. See Eq. (15) for the aggregation rate (\(g\)) and Eq. (14)} for the function (\(f^{lim}_{dia}\)) limiting the excretion rate (\(\epsilon^N_{dia}\)).
Silicate assimilation is treated as a relatively independent metabolic pathway. Here, silicon uptake is formulated as Michaelis-Menten kinetics. The maximum silicon uptake rate is calculated from the constant maximum photosynthesis rate (\(\mu^{max}_{dia}\)) by multiplying it with a constant maximum Si:C uptake ratio (\(\sigma_{dia}^{Si}\)), and is regulated by intracellular N:C and Si:C ratios (\(f^{lim}_{dia}\) and \(f^{Si}_{dia}\)) and temperature (\(f_{T}\)). Silicon uptake is reduced when cellular Si:C ratios (\(q^{Si}\)) approach the maximum Si:C ratio (\(q_{max}^{Si}\)). \(\theta_{max}^{Si}\) is a dimensionless constant which is used to regulate the slope.
Iron limitation shows an indirect influence on silicate assimilation via variable intracellular Si:N:C ratios by affecting the assimilation of nitrogen and carbon. See Eq. (14) for the description of the limiting function \(f^{lim}_{dia}\) and Eq. (22) for the definition of the temperature dependence \(f_{T}\).
Calcite pool (\(\mathrm{CaCO}_{3 \, phy}\))
In REcoM-2, the formation of biogenic calcium carbonate is limited to phytoplankton (i.e.coccolithophorids) which are assumed to form a constant fraction of the non-diatom phytoplankton. Formation of \(CaCO_3\) by heterotrophs, such as foraminifera or pteropods is neglected. Biogenic \(CaCO_3\) is transformed into detritus \(CaCO_3\) along with organic matter excretion, respiration, aggregation and grazing.
Calcification (\(Z\)) is proportional to gross carbon fixation by nanophytoplankton:
$psi$ is the calcite production ratio that incorporates the ratio of calcium carbonate producers to total nanophytoplankton and the \(CaCO_3\):POC ratio in coccolithophorids. The latter is assumed to be 1.
See Eq. (13) for the function \(f^{lim}_{phy}\) limiting the excretion rate \(\epsilon^C_{phy}\). Nanophytoplankton photosynthesis (\(p_{phy}\)) respiration (\(r_{phy}\)) and aggregation (\(g\)) rates are defined in Eq. (18), Eq. (26) and Eq. (15), respectively. The grazing flux \(G_{phy}\) (Eq. (40)) is calculated in units of nitrogen biomass and converted to \(CaCO_3\) using the intracellular \(CaCO_3\):N ratio (\(q^{CaCO_3:N}_{phy}\)).
Heterotrophs
Nitrogen pool (\(\mathrm{N}_{het}\))
Heterotrophic zooplankton increase their nitrogen pool via grazing, and loose nitrogen through excretion of \(\mathrm{DON}\) and a quadratic mortality term:
A quadratic term is used for the mortality of heterotrophs (\(m_{het} \cdot \mathrm{N}_{het}^2\)), and the excretion rate \(\epsilon^{N}_{het}\) transfers heterotrophic nitrogen directly to the \(\mathrm{DON}\) pool. The grazing efficiency \(\gamma\) determines how much of the grazed phytoplankton is built into heterotrophic biomass. We assume that sloppy feeding and the formation of feces transfer the remainder of the grazed phytoplankton directly to detritus.
The grazing on nanophytoplankton and diatoms is defined as:
The grazing rate is calculated from a constant maximum grazing rate (\(\xi\)) by multiplication with a sigmoidal dependency of nutritional intake to resource density with half-saturation constant \(\varphi_{1}\). It depends on temperature following the same relationship as for phytoplankton growth (\(f_{T}\)). \(\mathrm{N}_{dia}'\) encompasses a preference term for grazing on diatoms, relative to that on nanophytoplankton:
Here, \(\tau\) is the maximum diatom preference and is smaller than one, which implies that zooplankton grazes preferably on nanophytoplankton; the effective grazing preference is allowed to vary with diatom biomass, with \(\varphi_{2}\) being the half saturation parameters for grazing preference of diatoms. \(\varphi_{2}=0\) implies a constant preference.
The relative contributions of grazing on nanophytoplankton and on diatoms to the total grazing flux are calculated by their respective proportion to the total zooplankton food resource.
Carbon pool (\(\mathrm{C}_{het}\))
The heterotrophic carbon biomass is a balance between carbon uptake via grazing and carbon loss via mortality, carbon excretion and respiration.
The grazing flux in terms of nitrogen biomass is converted to carbon biomass using the respective intracellular N:C ratios (\(q_{phy}\) and \(q_{dia}\)). Sloppy feeding causes some of the grazed phytoplankton to be transferred directly to the detritus pool, as determined by the grazing efficiency \(\gamma\). The remainder is built into heterotropic biomass. The quadratic mortality flux (\(m_{het} \cdot \mathrm{N}_{het}^2\)), which causes carbon to be lost to the detritus compartment, is converted to carbon using the intracellular heterotrophic N:C ratio (\(q_{het}\)). When the C:N ratio in heterotrophs (\(q^{C:N}_{het}\) = 1/\(q_{het}\)) exceeds the Redfield ratio, heterotrophic respiration is assumed to drive the ratio back towards Redfield, with a time-scale \(\kappa_{het}\):
Detritus
paragraph{Nitrogen pool (\(\mathrm{N}_{det}\))} Losses of phytoplankton nitrogen due to aggregation, mortality and sloppy feeding have to pass the \(\mathrm{N}_{det}\) compartment before being degraded to \(\mathrm{DON}\), which is the only loss term for detrital nitrogen.
See section Heterotrophs for a definition of the grazing flux \(G\), the grazing efficiency \(\gamma\) and the zooplankton mortality flux (\(m_{het} \cdot \mathrm{N}_{het}^2\)). The aggregation rate \(g\) is defined in Eq. (15). Degradation of \(N_{det}\) to DON is based on a constant degradation rate (\(\rho_{PON}\)) and a temperature dependency (\(f_T\), Eq. (22)).
Carbon pool (\(\mathrm{C}_{det}\))
The \(\mathrm{C}_{det}\) compartment is balanced by carbon sources associated with sloppy feeding, aggregation of phytoplankton, mortality of heterotrophs and degradation of \(\mathrm{C}_{det}\) to \(\mathrm{DOC}\) as the only loss term.
The grazing and the quadratic mortality flux (see section Heterotrophs), which are calculated in terms of N biomass, are converted to carbon biomass via the respective intracellular N:C ratios (\(q_{phy}\), \(q_{dia}\) and \(q_{het}\)). The sloppy feeding part of the grazing flux is transfered to the \(\mathrm{C}_{det}\) compartment, while the main grazing flux is built into heterotrophic biomass, as determined by the grazing efficiency \(\gamma\). The degradation term consists of a constant degradation rate \(\rho_{POC}\) and takes into account a temperature dependency \(f_T\) (see Eq. (22)).
Silica pool (\(\mathrm{Si}_{det}\))
The detrital silica budget consists of aggregation, grazing and excretion fluxes from diatoms to detritus and silica dissolution, which shifts silicon from \(\mathrm{Si}_{det}\) to dissolved silicate.
See section Phytoplankton for definitions of the aggregation (\(g\)) and excretion (\(\epsilon\)) fluxes and section Heterotrophs for the grazing fluxes (\(G\)).
The silica dissolution rate \(\rho_{Si}^T\) follows the temperature dependence of citet{Kamatani1982}, until it exceeds the maximum dissolution rate \(\rho_{Si}\)
paragraph{Calcium carbonate pool (\(\mathrm{CaCO}_{3\,det}\))} Nanophytoplankton loses \(CaCO_3\) to the detrital \(CaCO_3\) compartment via excretion, respiration, aggregation and grazing. Dissolution of \(CaCO$_3\) leads to an increase in \(\mathrm{DIC}\) and alkalinity (see section Carbonate chemistry).
The nanophytoplankton excretion term (\(\epsilon^C_{phy}\)) is regulated by intracellular quota as defined in Eq. (13). Refer to section Phytoplankton for a definition of the respiration (\(r_{phy}\)) and the aggregation (\(g\)) rates. The grazing flux is calculated in terms of nitrogen biomass (Eq. (40)) and is converted to \(\mathrm{CaCO}_{3\;det}\) by multiplication with the intracellular \(CaCO_3\):N ratio (\(q^{CaCO_3:N}_{phy}\)).
Detrital calcite decreases exponentially with water depth with a vertical length scale of 3500~m according to citet{YamanakaTajika1996}. The dissolution rate \(\lambda\) [\(d^{-1}\)] depends on the sinking speed of detritus, so that
where \(w_{det}\) increases with depth according to
Dissolved Organic Matter (DOM)
Dissolved Organic Nitrogen (\(\mathrm{DON}\))
\(\mathrm{DON}\) is produced via N excretion by nanophytoplankton, diatoms and heterotrophs, and by degradation of detrital N. It is turned into \(\mathrm{DIN}\) by remineralization.
The constant excretion rates of phytoplankton (\(\epsilon^N_{phy}\) and \(\epsilon^N_{dia}\)) are reduced if the N:C ratio is larger than a threshold (see Eq. (13) and Eq. (14)). Heterotrophic nitrogen excretion (\(\epsilon^N_{het} \cdot \mathrm{N}_{het}\)) depends only on the heterotrophic biomass. Degradation of \(\mathrm{N}_{det}\) to \(\mathrm{DON}\) and remineralization from \(\mathrm{DON}\) to \(\mathrm{DIN}\) is temperature dependent, so that the constant degradation (\(\rho_{PON}\)) and remineralization (\(\rho_{\mathrm{DON}}\)) rates are multiplied with the Arrhenius function (\(f_T\), see Eq. (22)).
Dissolved Organic Carbon (\(\mathrm{DOC}\))
$mathrm{DOC}$ sources are carbon excretion by nanophytoplankton, diatoms and heterotrophs, and degradation of \(\mathrm{C}_{det}\). Remineralization of \(\mathrm{DOC}\) leads to a transfer of carbon from \(\mathrm{DOC}\) to \(\mathrm{DIC}\).
Metabolic excretion of organic matter by phytoplankton is determined by a constant excretion rate and cell quota (\(\epsilon^C_{phy}\) and \(\epsilon^C_{dia}\), see section Phytoplankton). The heterotrophic excretion rate per heterotrophic biomass is constant (\(\epsilon^C_{het}\)). The constant degradation (\(\rho_{POC}\)) and remineralization (\(\rho_{\mathrm{DOC}}\)) rates that determine the fluxes from \(\mathrm{C}_{det}\) to \(\mathrm{DOC}\) and from \(\mathrm{DOC}\) to \(\mathrm{DIC}\) are altered following the Arrhenius function (\(f_T\), Eq. (22)).
Boundary conditions and early diagenesis
In its present version, REcoM-2 considers neither riverine input of nutrients, carbon and alkalinity, nor permanent burial of organic matter, calcium carbonate and silica in the sediment. At the sea surface, we assume no normal flux of tracers, except for \(\mathrm{DIC}\) that can exchange with the atmospheric reservoir of \(CO_2\). This surface boundary condition can be written as
where \(\eta\) is the sea surface elevation, and the air-sea flux of carbon \(F_{\mathrm{C}}\) (positive for flux out of the ocean) is calculated from \(\mathrm{DIC}\), \(\mathrm{TA}\), atmospheric \(pCO_2\), temperature, salinity and wind speed, follwing OCMIP protocols. Likewise, we assume no horizontal flux of tracers at lateral boundaries.
At the bottom of the ocean, the sinking flux of particulates (nanophytoplankton, diatoms and detritus) is directed into a homogeneous sediment layer, where POC and PON are degraded and instantaneously remineralized and calcium carbonate and silica are dissolved with fixed rates. The corresponding equations are
where \(\mathrm{POC}_{sed}\), \(\mathrm{POC}_{sed}\), \(\mathrm{Si}_{sed}\), and \(\mathrm{CaCO}_{3\,sed}\) are vertically integrated concentrations in the sediment layer, i.e.they have the unit mol \(m^{-2}\). \(d^{C}\), \(d^{N}\), \(d^{Si}\), and \(d^{CaCO_3}\) are the degradation or dissolution rates for POC, PON, Si and \(CaCO_3\), respectively.
The nutrients and alkalinity released during the degradation/remineralization and dissolution are directly returned into the water as a flux, i.e.the boundary condition at the ocean bottom is